

Our tree inventory automatically detects and analyses individual tree crowns based on orthophotos with 4 cm GSD and LiDAR Point Cloud data (>20 pts/m²). Each tree receives attributes such as area, height and crown width, delivered as accurate vector layers. The inventory can be applied at the scale of an entire municipality, street zones or specific areas of interest. Thanks to the link with Plan3D's Oblique Webviewer you have visual validation in both 2D and 3D. This gives you always current, reliable and actionable information for policy, management and operational projects.
Our tree inventory provides a detailed map layer of all trees within a defined area, based on LiDAR Point Cloud data (from 30 pts/m²) and orthophotos (GSD from 3 cm), combined with advanced object detection algorithms. Each tree is automatically identified and assigned attributes such as:
All detections are verified through a quality control process, keeping false positives below 5% and false negatives below 10%, ensuring reliability throughout.
In collaboration with EAVISE (KU Leuven) we are also exploring possibilities for determining tree species and trunk diameters, to make future analyses even richer.
All data is delivered in ready-to-use GIS formats and coordinate systems. The dataset can easily be delivered via FTP and integrates directly into existing GIS systems or into the Plan3D Oblique Webviewer for immediate visualisation and analysis.
Our detections are accurate and always verified through a thorough quality control process. We also offer historical datasets, so changes over time can be tracked. There is always one dedicated point of contact available for support and integration into your systems.


With this dataset a municipality can efficiently apply the 3-30-300 rule: three visible trees per home, 30% tree coverage per neighbourhood and a maximum distance of 300 metres to public green space. On request we also provide guidance and advice to support data-driven and targeted implementation.
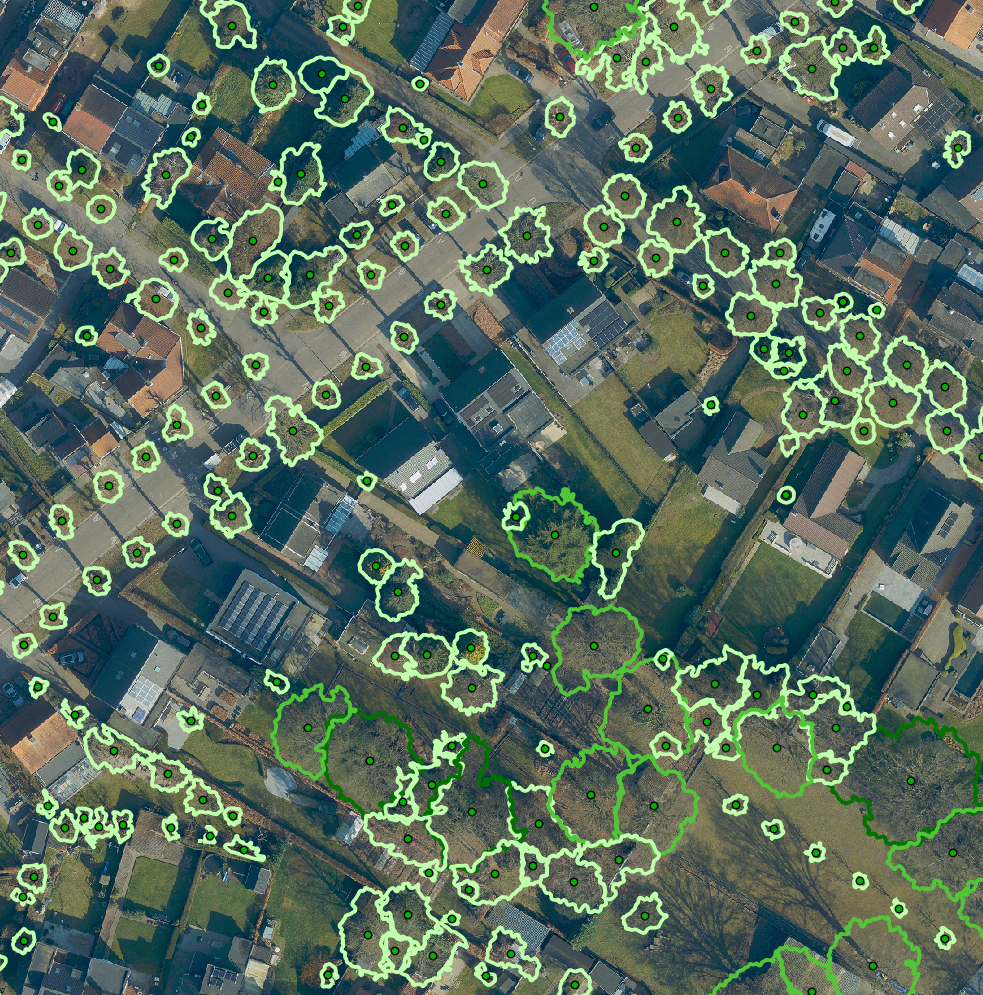
Our tree inventory provides detailed information on individual trees, including height, crown area, width, centroid and treetop position, with accuracy guaranteed through quality control. Optionally we carry out advanced analyses such as tree density, crown distribution, clustering, percentage coverage and changes over time. These insights support urban spatial planning, green space management and strategic decision-making.

The tree inventory forms an ideal basis for urban spatial planning, green space management and risk assessment. Using the data, you can analyse tree density, street canopy coverage and potential obstacles for infrastructure. Moreover, this dataset can be used to add further information on green space management or serve as a basis in existing inventory tools. In collaboration with KU Leuven we are also exploring the possibility of determining tree species and trunk diameters, enabling even richer analyses and policy insights.
With this dataset a municipality can efficiently apply the 3-30-300 rule: three visible trees per home, 30% tree coverage per neighbourhood and a maximum distance of 300 metres to public green space. On request we also provide guidance and advice to support data-driven and targeted implementation.
Our tree inventory provides detailed information on individual trees, including height, crown area, width, centroid and treetop position, with accuracy guaranteed through quality control. Optionally we carry out advanced analyses such as tree density, crown distribution, clustering, percentage coverage and changes over time. These insights support urban spatial planning, green space management and strategic decision-making.
The tree inventory forms an ideal basis for urban spatial planning, green space management and risk assessment. Using the data, you can analyse tree density, street canopy coverage and potential obstacles for infrastructure. Moreover, this dataset can be used to add further information on green space management or serve as a basis in existing inventory tools. In collaboration with KU Leuven we are also exploring the possibility of determining tree species and trunk diameters, enabling even richer analyses and policy insights.

By 2040, Flanders must be asbestos-safe. Our aerial imagery and Deep Learning flag which roofs are suspected per address, so we can work together efficiently towards a healthier and safer living environment.
read more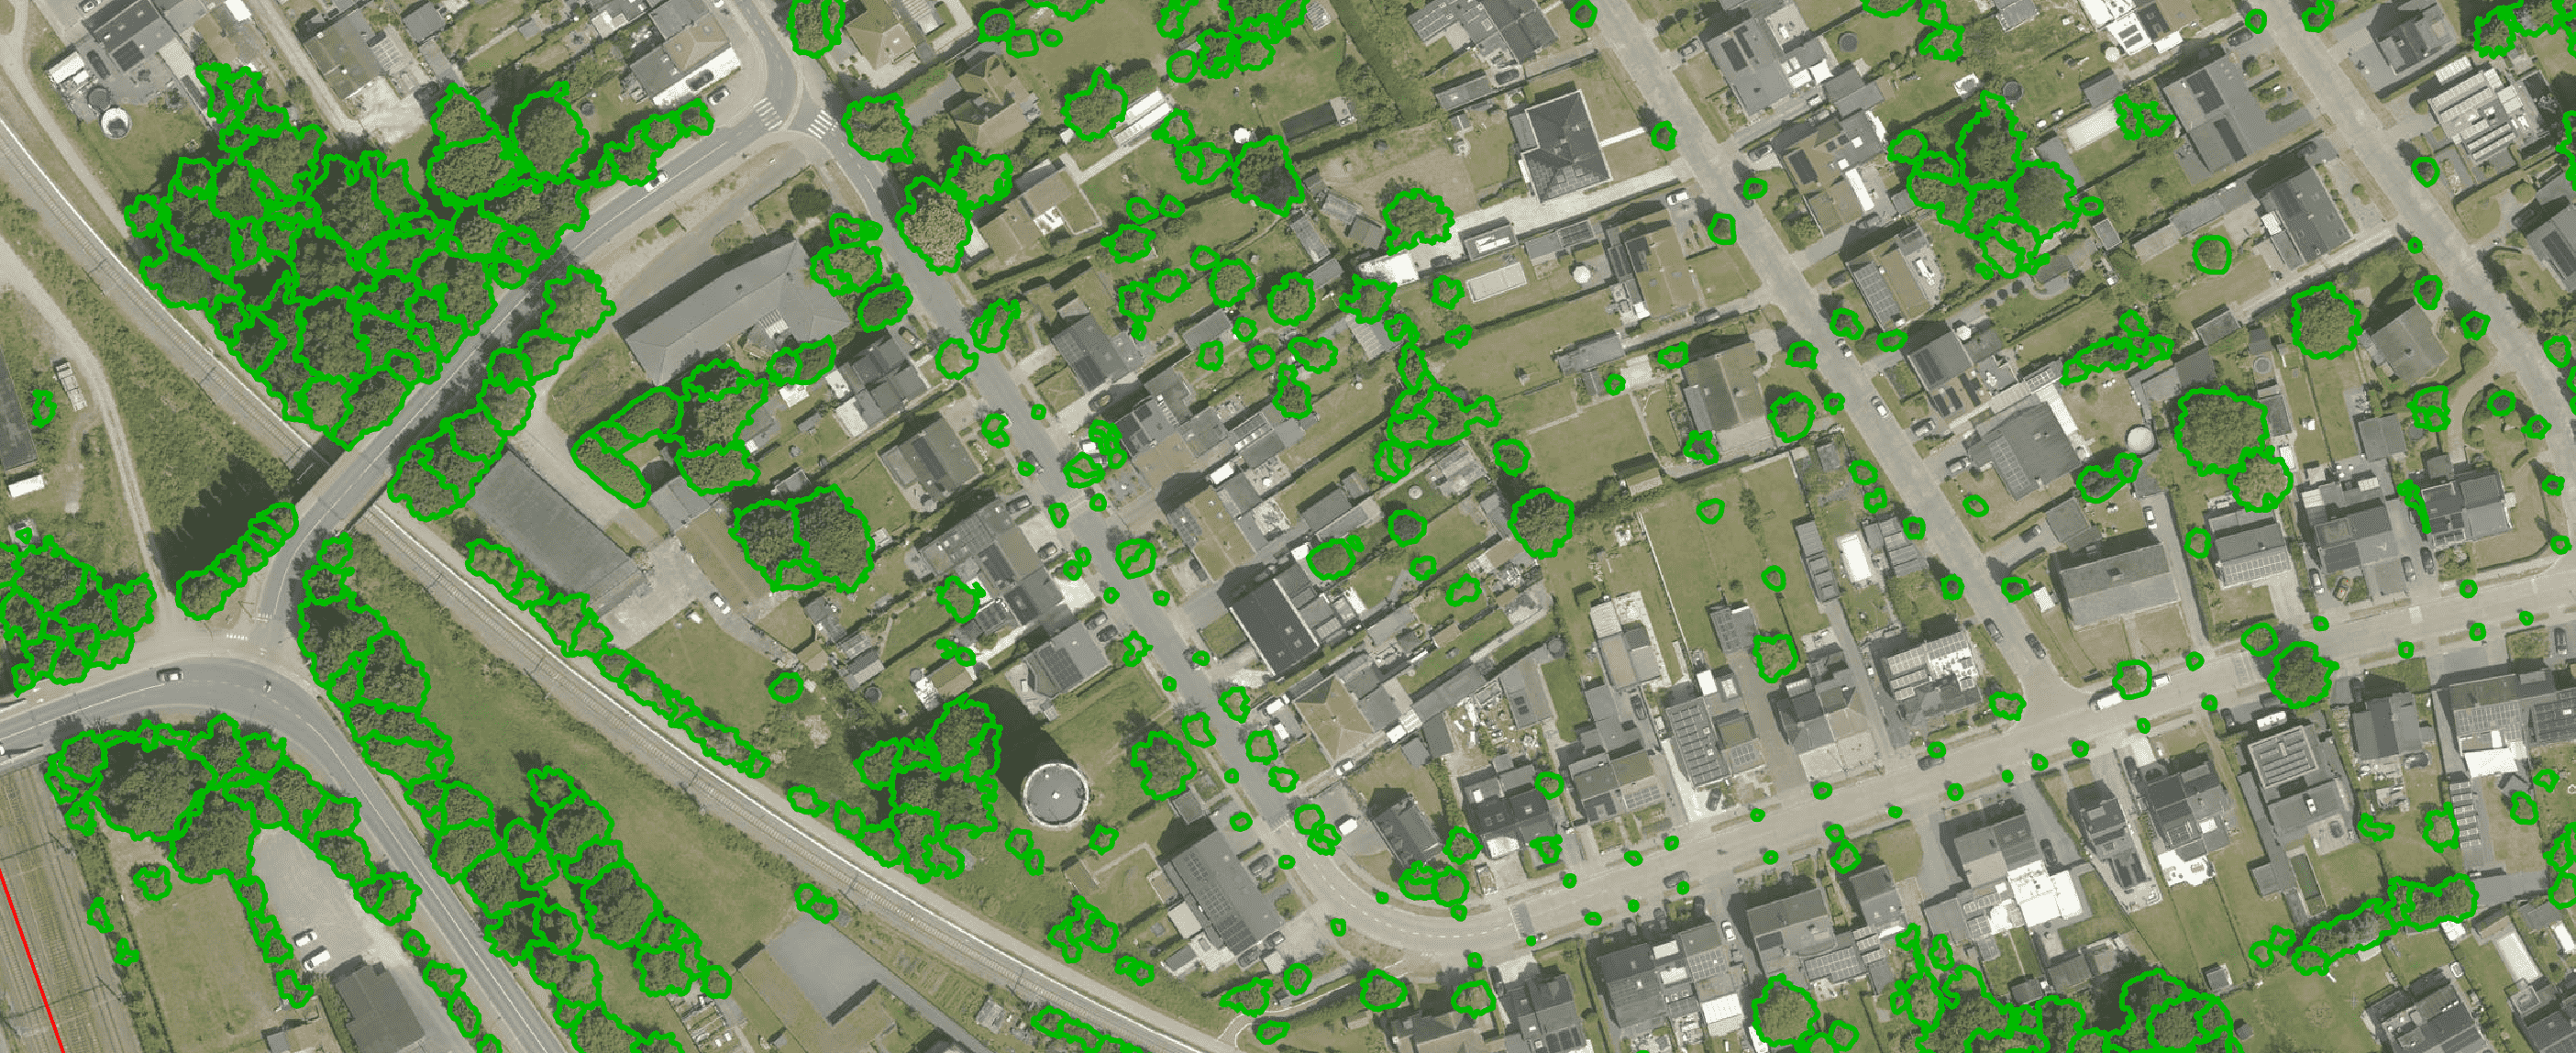
Get a complete overview of trees in your area, including individual characteristics such as crown area and height, and use the data to apply the European 3-30-300 rule for optimal urban greening. Ideal for municipalities, planners and green space managers who need accurate, scalable and policy-relevant geospatial data
read more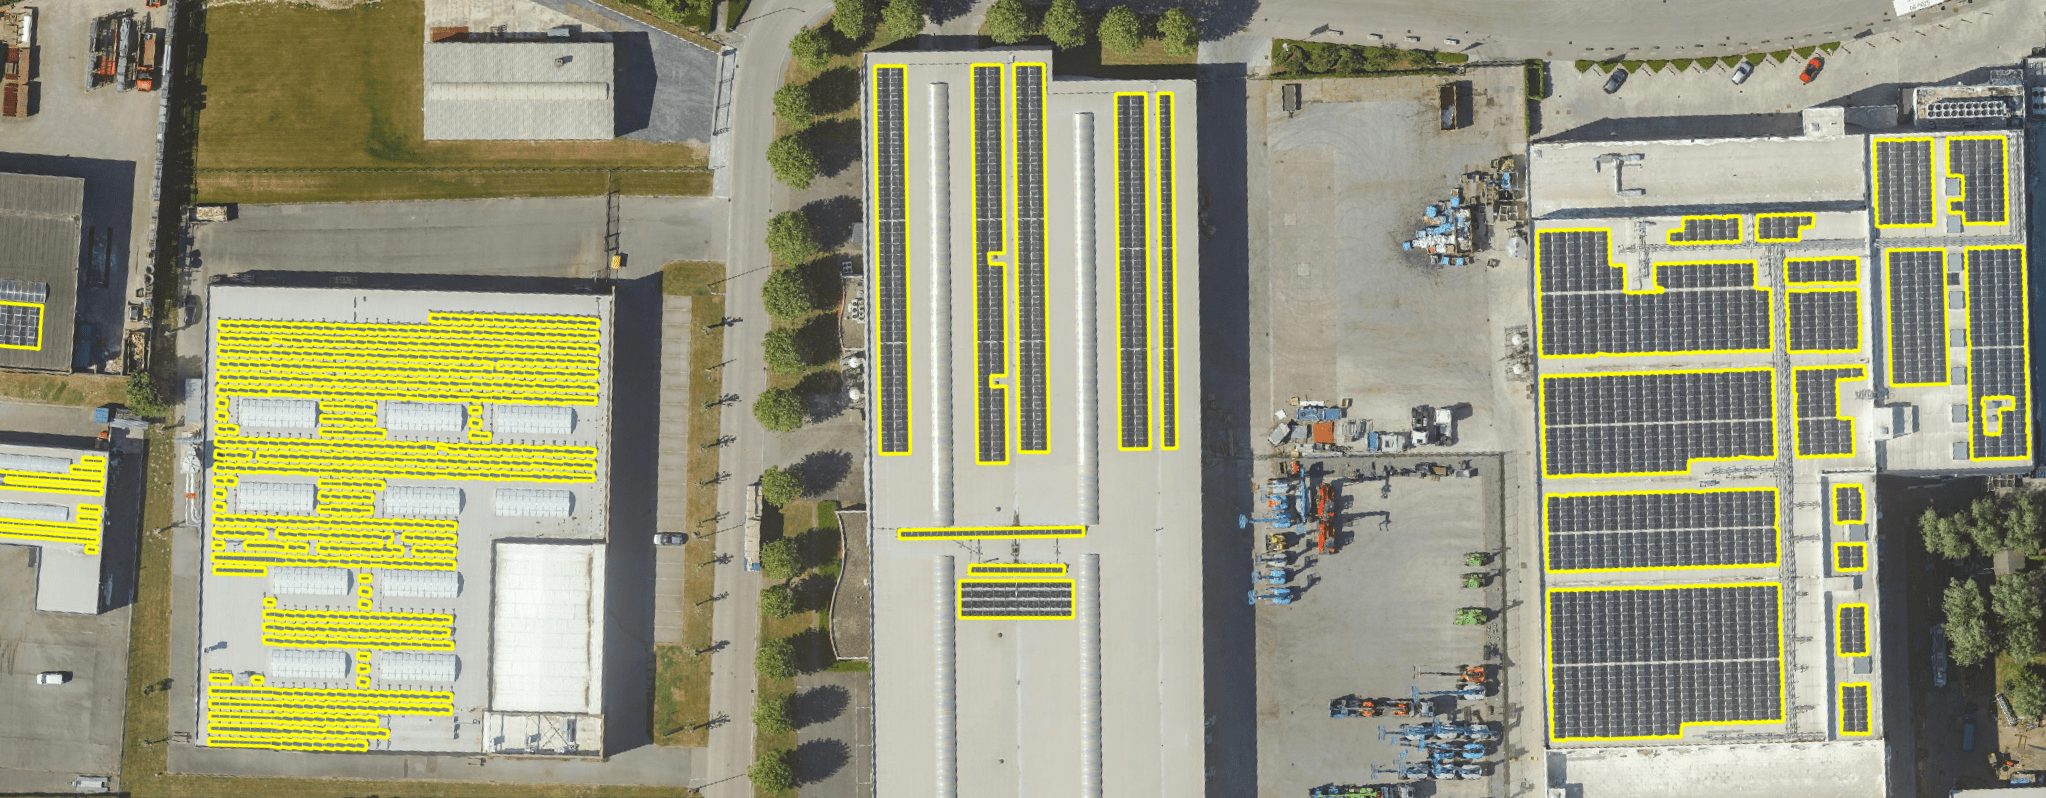
Get a detailed map layer of solar panels at building or cluster level, including surface area calculations per cluster. Ideal for anyone working with geospatial data who wants insight into energy potential and roof utilisation.
read more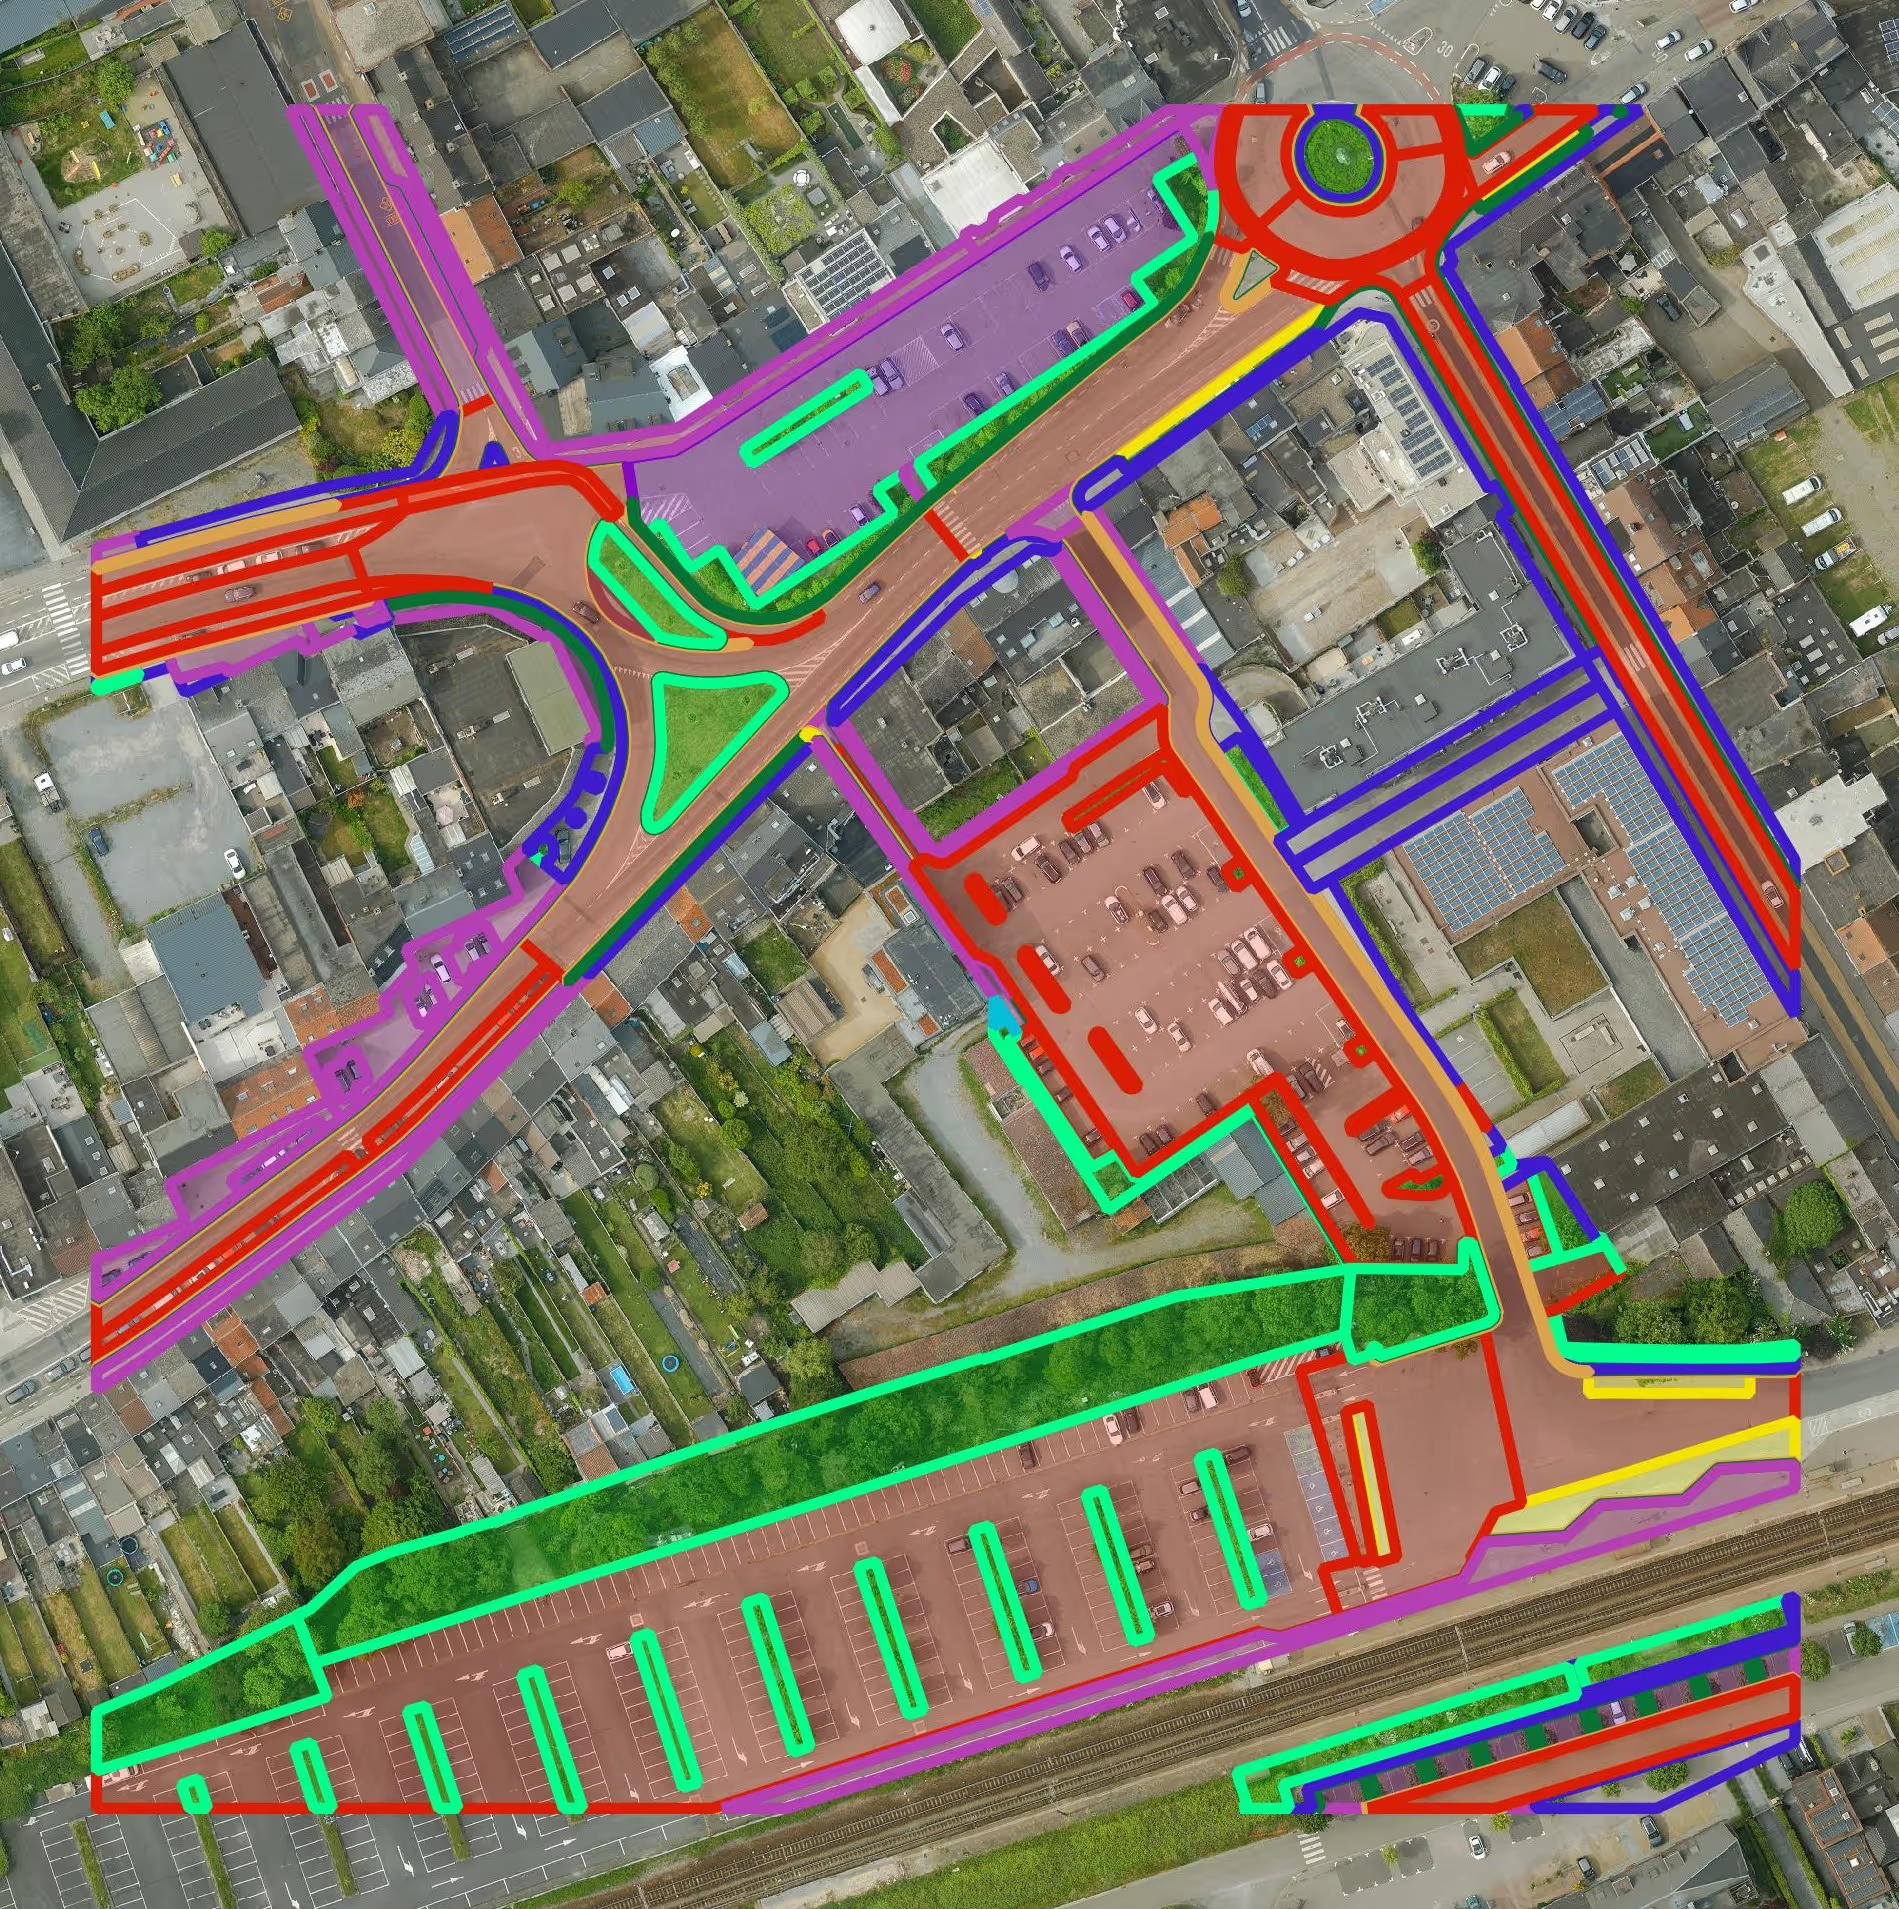
Get a detailed map layer of the public space with classification by object and material. Ideal for anyone working with geospatial data who needs more detail than existing reference data provides.
read more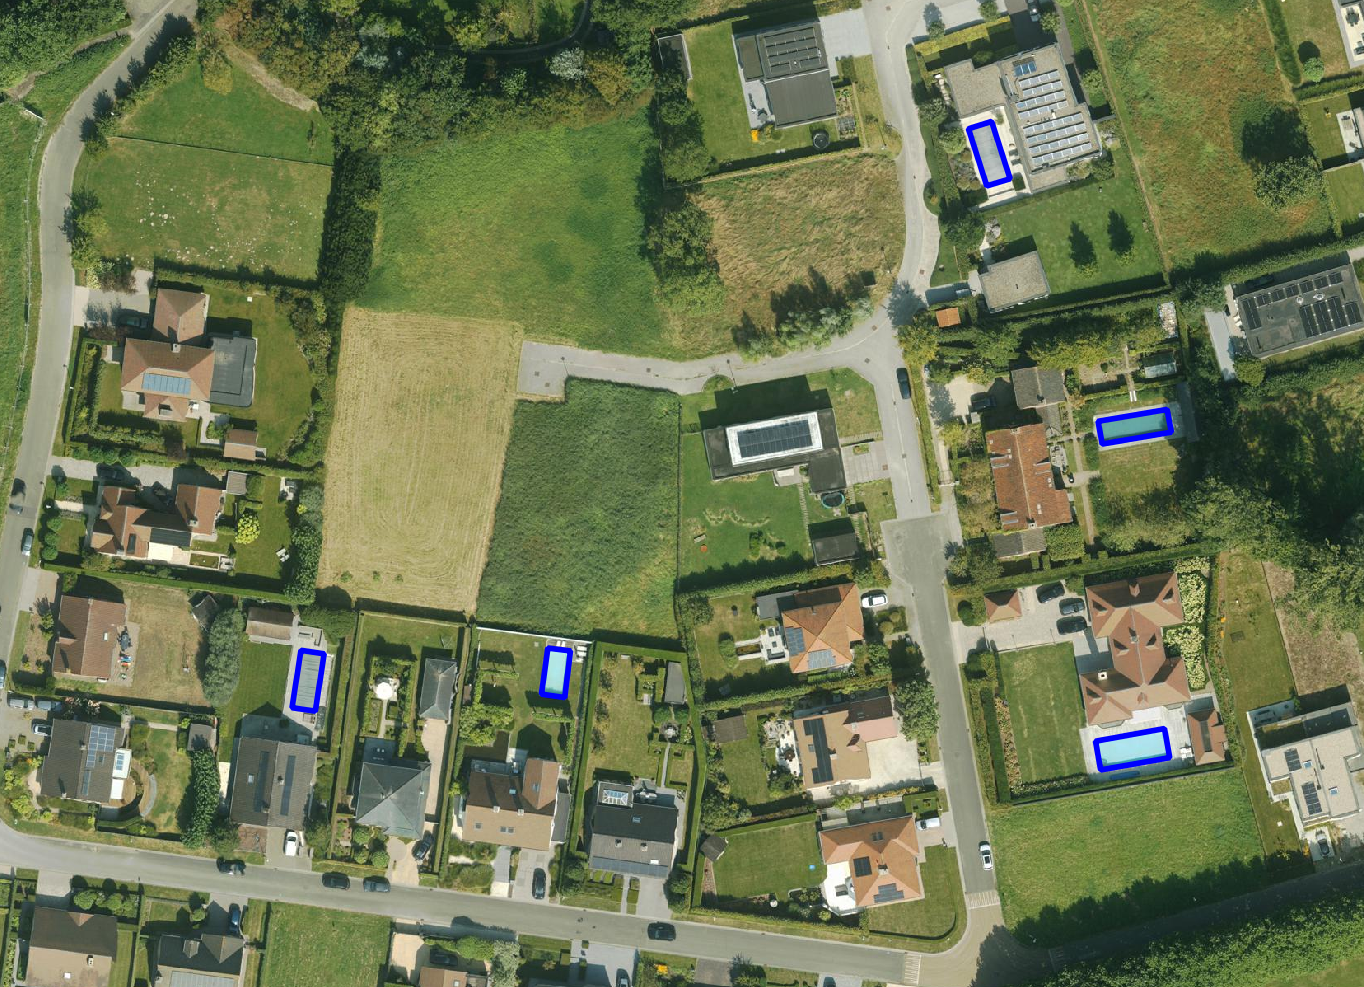
Get a detailed map layer of swimming pools at parcel or object level, including surface area calculations. Ideal for anyone using geospatial data for policy analysis, permits or trend research.
read more
Get a complete inventory of all road markings within your project area, classified into objects, lines and surfaces and linked to the correct underlying surface. This gives you objective data to support maintenance planning, reporting and policy decisions around mobility and asset management.
read more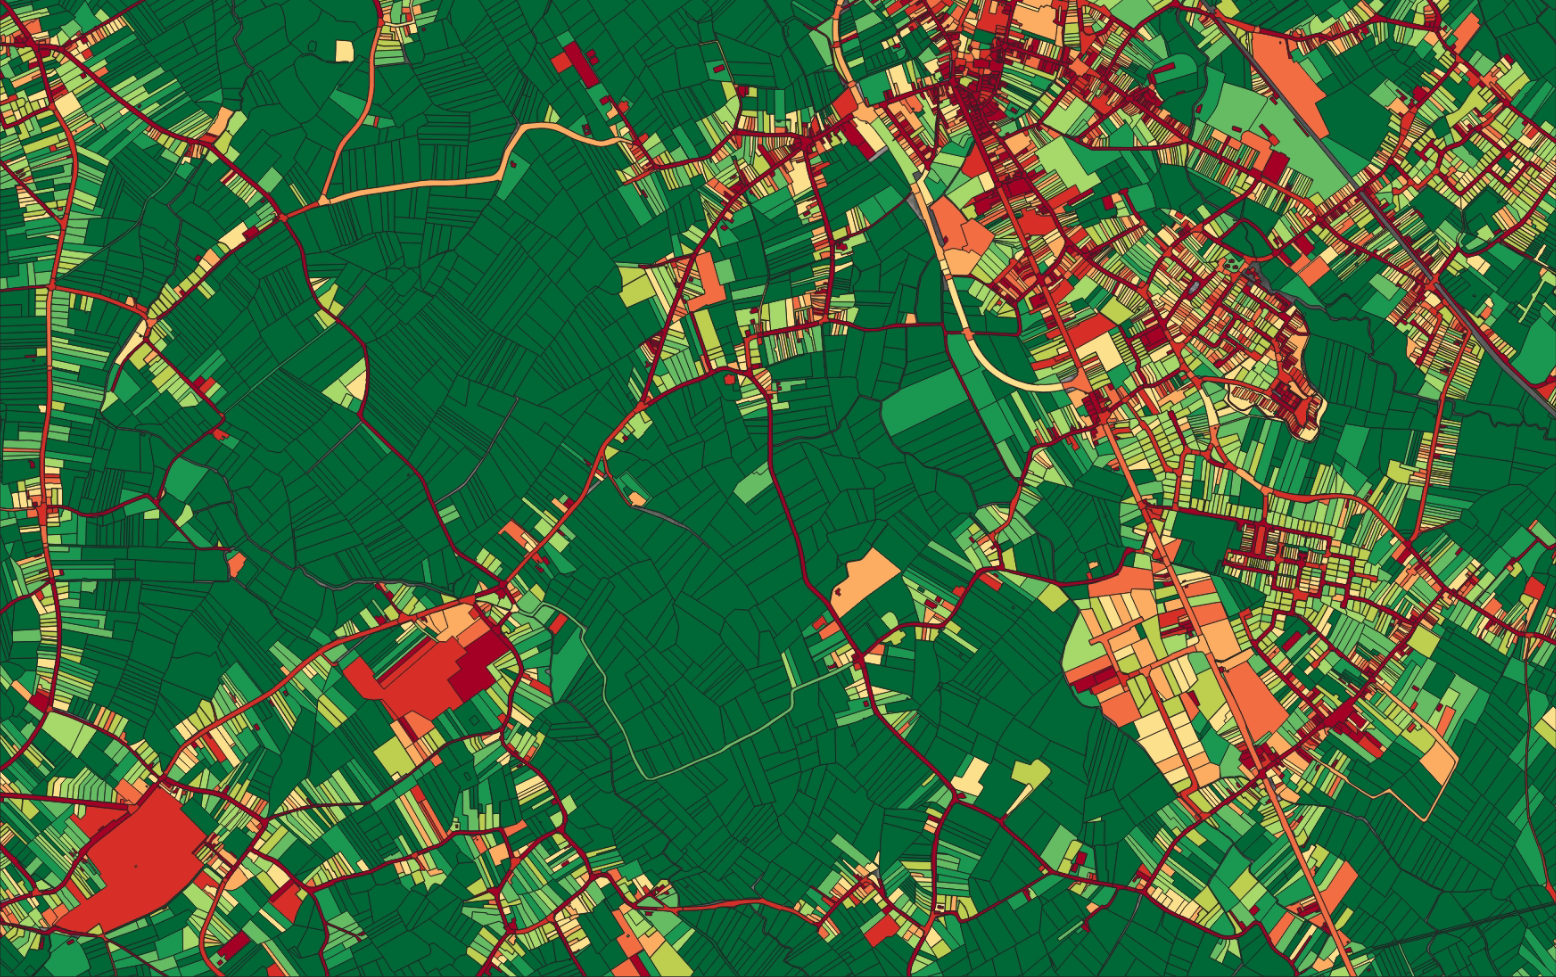
Our paved/unpaved surface maps provide a complete and objective overview of where the ground is paved or unpaved, in both private and public space.
read moreEvery possible element of a cemetery is mapped. The result is a clear and organised plan that supports efficient and transparent cemetery management.
read more
Do you need a specific inventory that is not yet in our offering? We develop custom inventories tailored to your project. Thanks to our experience with aerial imagery and Deep Learning, we can detect and map almost any object type. Get in touch to discuss the possibilities.
Get in touchBy 2040, Flanders must be asbestos-safe. Our aerial imagery and Deep Learning flag which roofs are suspected per address, so we can work together efficiently towards a healthier and safer living environment.
read moreGet a complete overview of trees in your area, including individual characteristics such as crown area and height, and use the data to apply the European 3-30-300 rule for optimal urban greening. Ideal for municipalities, planners and green space managers who need accurate, scalable and policy-relevant geospatial data.
read moreGet a detailed map layer of solar panels at building or cluster level, including surface area calculations per cluster. Ideal for anyone working with geospatial data who wants insight into energy potential and roof utilisation.
read more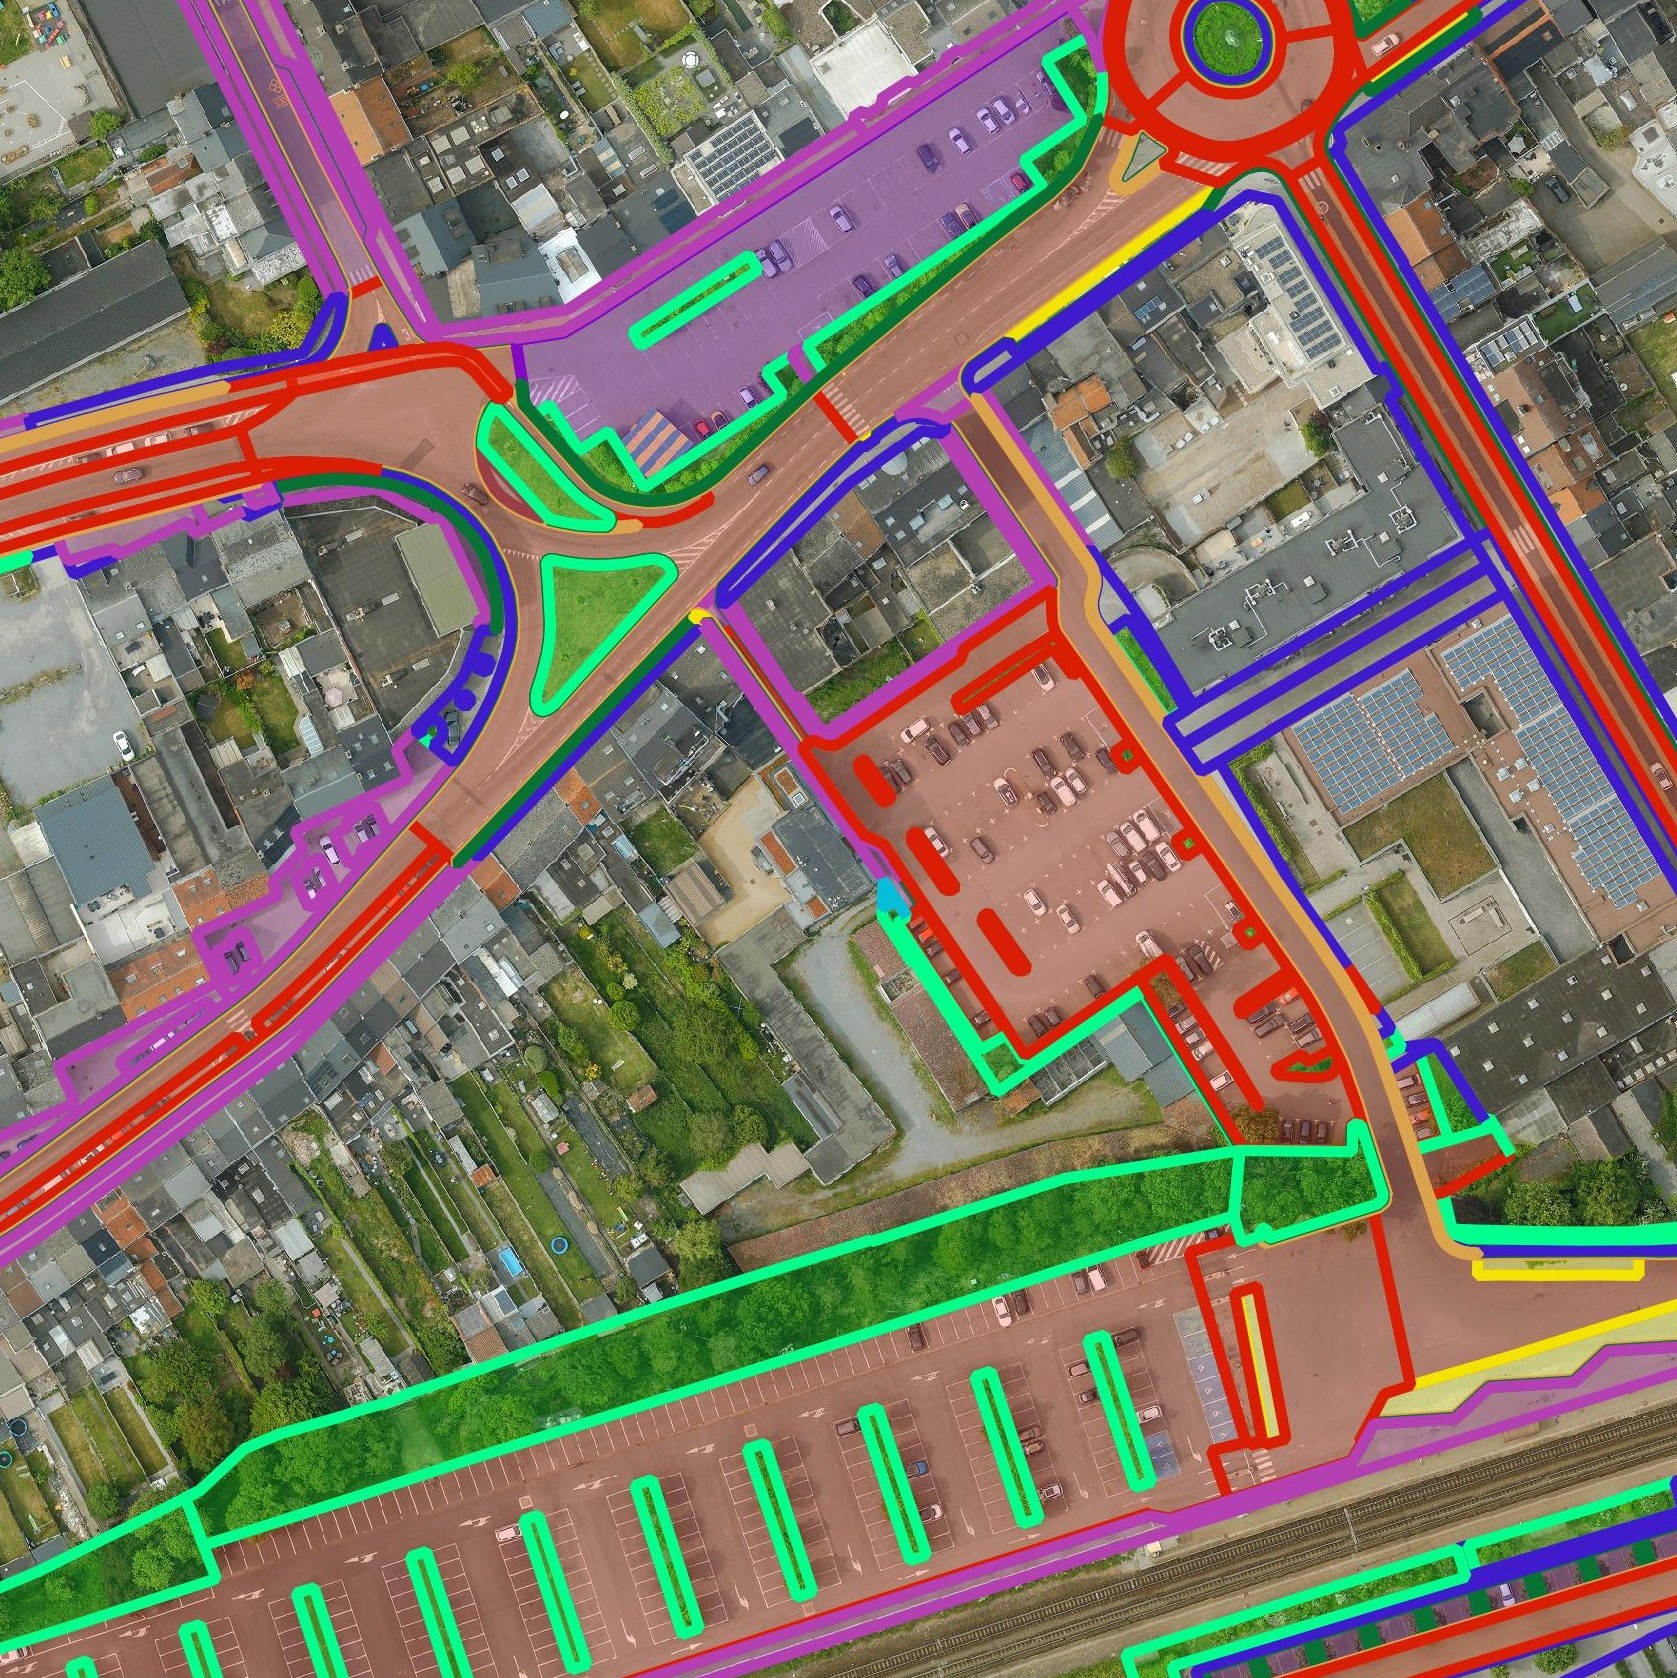
Get a detailed map layer of the public space with classification by object and material. Ideal for anyone working with geospatial data who needs more detail than existing reference data provides.
read moreGet a detailed map layer of swimming pools at parcel or object level, including surface area calculations. Ideal for anyone using geospatial data for policy analysis, permits or trend research.
read moreGet a complete inventory of all road markings within your project area, classified into objects, lines and surfaces and linked to the correct underlying surface. This gives you objective data to support maintenance planning, reporting and policy decisions around mobility and asset management.
read moreOur pavement surface maps provide a complete and objective overview of where the ground is paved or unpaved, in both private and public space.
read moreEvery possible element of a cemetery is mapped. The result is a clear and organised plan that supports efficient and transparent cemetery management.
read moreDo you need a specific inventory that is not yet in our offering? We develop custom inventories tailored to your project. Thanks to our experience with aerial imagery and Deep Learning, we can detect and map almost any object type. Get in touch to discuss the possibilities.
Get in touch
Municipalities can use the urban tree mapping to monitor tree density, plan urban greening and effectively implement green strategies.

The data supports climate adaptation plans, the calculation of CO₂ absorption and the analysis of urban heat islands.

Infrastructure managers can identify obstacles along roads, rail lines and utility networks and carry out maintenance and planning more efficiently.
Municipalities can use the urban tree mapping to monitor tree density, plan urban greening and effectively implement green strategies.
The data supports climate adaptation plans, the calculation of CO₂ absorption and the analysis of urban heat islands.
Infrastructure managers can identify obstacles along roads, rail lines and utility networks and carry out maintenance and planning more efficiently.

