Onze verhardingskaarten geven een volledig en objectief beeld van de mate van verhardingen in zowel private als publieke zones, inclusief opritten, daken, wegen en andere oppervlakken. Zo krijg je in één oogopslag inzicht in waar de bodem waterdoorlatend of afgesloten is. Door middel van AI-gedreven beeldanalyse op onze hoogwaardige Plan3D orthofoto’s (GSD vanaf 3 cm) classificeren we elk stukje oppervlak. Het resultaat is een nauwkeurige, gebiedsdekkende kaart van verharding, ideaal voor beleidsmakers.Het product bestaat uit drie kaarten:Private ruimte: shapefile met de berekening van de verhardingsgraad per perceel (GRB – ADP).Publieke ruimte: shapefile met de verhardingsgraad per terrein of wegbaan (GRB – TRN/WBN).Rasterweergave: een 5 × 5 m grid dat het percentage verharding weergeeft per cel.
Our pavement surface maps give a complete and objective picture of the degree of surface sealing in both private and public zones, including driveways, rooftops, roads and other surfaces. This gives you at a glance an insight into where the ground is permeable or sealed. Through AI-driven image analysis on our high-quality Plan3D True Orthophotos (GSD from 3 cm), we classify every piece of surface. The result is an accurate, area-wide impervious surface map, ideal for policymakers.
The product consists of three maps:
We deliver the data ready to use in standard GIS formats (Shapefile, CAD and/or raster files), so they are immediately usable. The paved/unpaved surface maps can easily be linked to our Plan3D Webviewer or integrated into your own GIS environment. Our maps can also be combined with other Plan3D layers such as buildings, parcels or waterways to generate deeper insights.
We deliver the paved/unpaved surface map verified through a fixed quality procedure and according to a schedule agreed in advance. Our maps achieve a minimum accuracy of 90%, so you can be confident of reliable results at the right time.


The maps are based on Deep Learning semantic segmentation, a technique in which a Convolutional Neural Network (CNN) automatically assigns a material type to every pixel in our orthophotos. All classes are then grouped as paved or unpaved. This produces a raster file in which the degree of surface sealing per location, parcel or grid cell is shown exactly. Thanks to a thorough quality control (QC) process, incorrect detections are corrected manually.

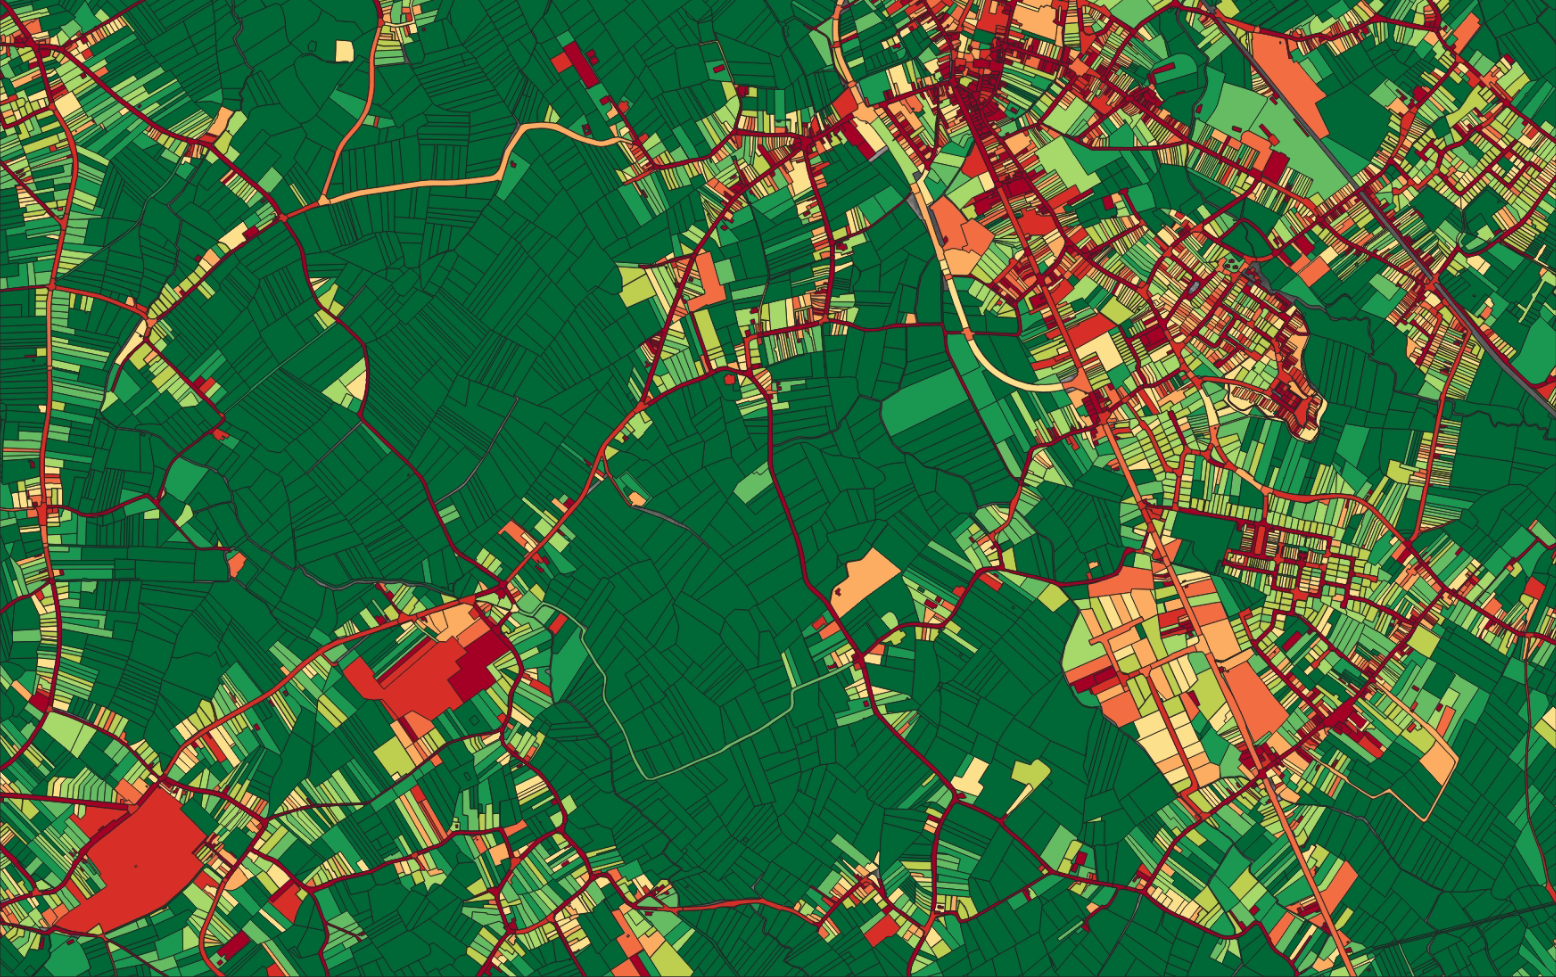
Our paved/unpaved surface maps for private and public space show the degree of surface sealing per parcel or terrain, calculated based on the number of sealed pixels relative to the total. For private parcels we use GRB-ADP geometries, for public zones GRB-TRN and WBN layers. This gives you an accurate sealing percentage, suitable for policy, maintenance and spatial analyses.
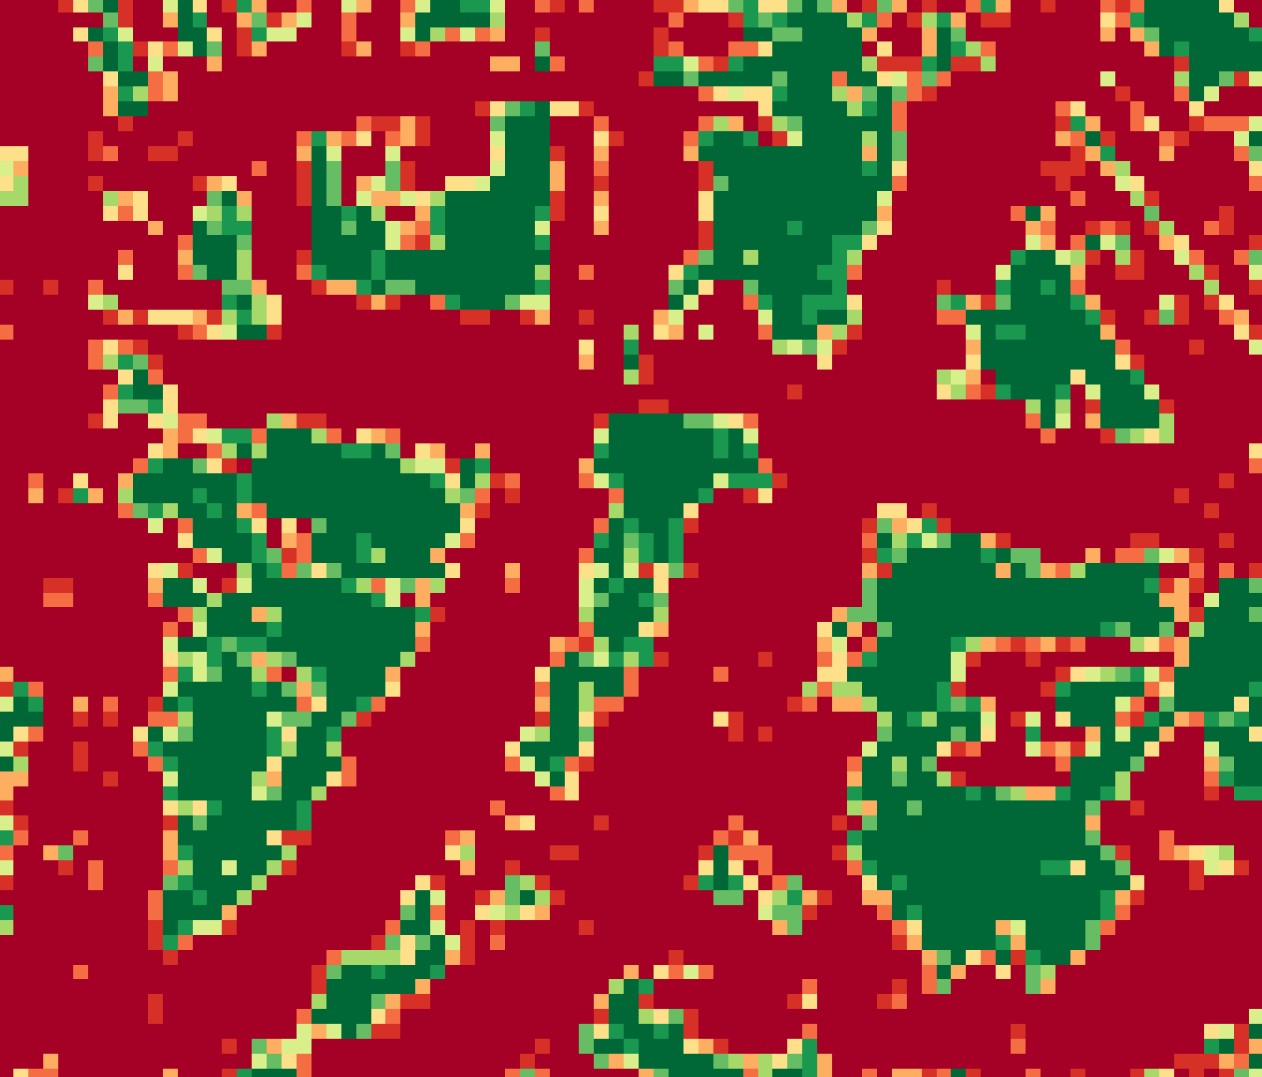
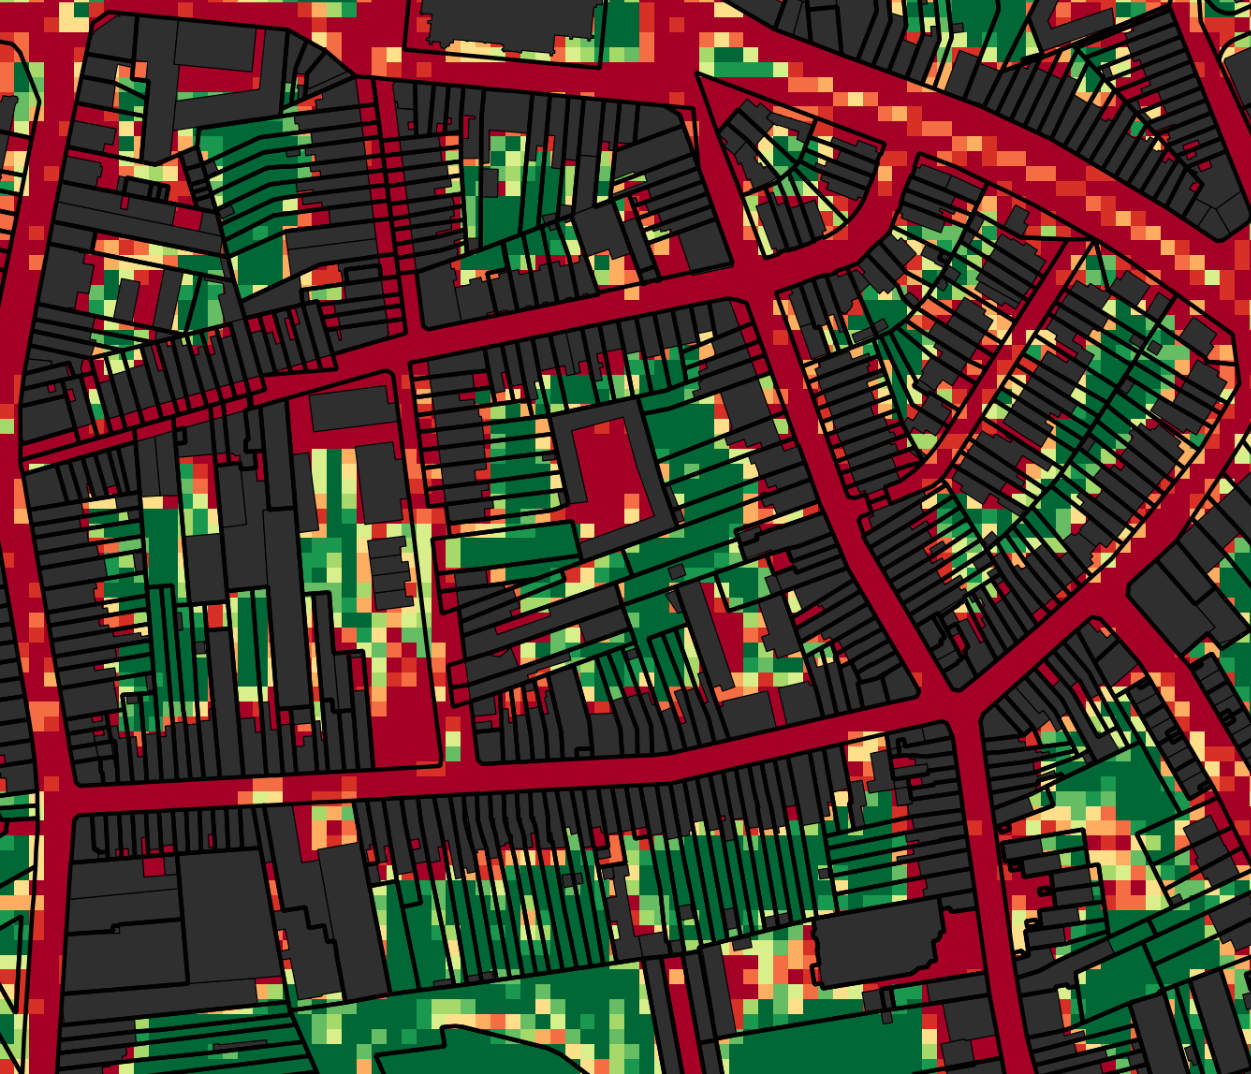
The raster view converts the classification of every pixel into a uniform 5×5 m raster, where each cell receives a surface sealing percentage. This provides an area-wide and objective visualisation, independent of parcel boundaries or administrative divisions. The raster map can easily be combined with other open data, such as buildings and parcels, for detailed analyses of urban surfaces and water permeability. This allows you to compare trends in surface sealing over time or accurately monitor changes in specific areas.
The maps are based on Deep Learning semantic segmentation, a technique in which a Convolutional Neural Network (CNN) automatically assigns a material type to every pixel in our orthophotos. All classes are then grouped as paved or unpaved. This produces a raster file in which the degree of surface sealing per location, parcel or grid cell is shown exactly. Thanks to a thorough quality control (QC) process, incorrect detections are corrected manually.
Our paved/unpaved surface maps for private and public space show the degree of surface sealing per parcel or terrain, calculated based on the number of sealed pixels relative to the total. For private parcels we use GRB-ADP geometries, for public zones GRB-TRN and WBN layers. This gives you an accurate sealing percentage, suitable for policy, maintenance and spatial analyses.
The raster view converts the classification of every pixel into a uniform 5×5 m raster, where each cell receives a surface sealing percentage. This provides an area-wide and objective visualisation, independent of parcel boundaries or administrative divisions. The raster map can easily be combined with other open data, such as buildings and parcels, for detailed analyses of urban surfaces and water permeability. This allows you to compare trends in surface sealing over time or accurately monitor changes in specific areas.

By 2040, Flanders must be asbestos-safe. Our aerial imagery and Deep Learning flag which roofs are suspected per address, so we can work together efficiently towards a healthier and safer living environment.
read more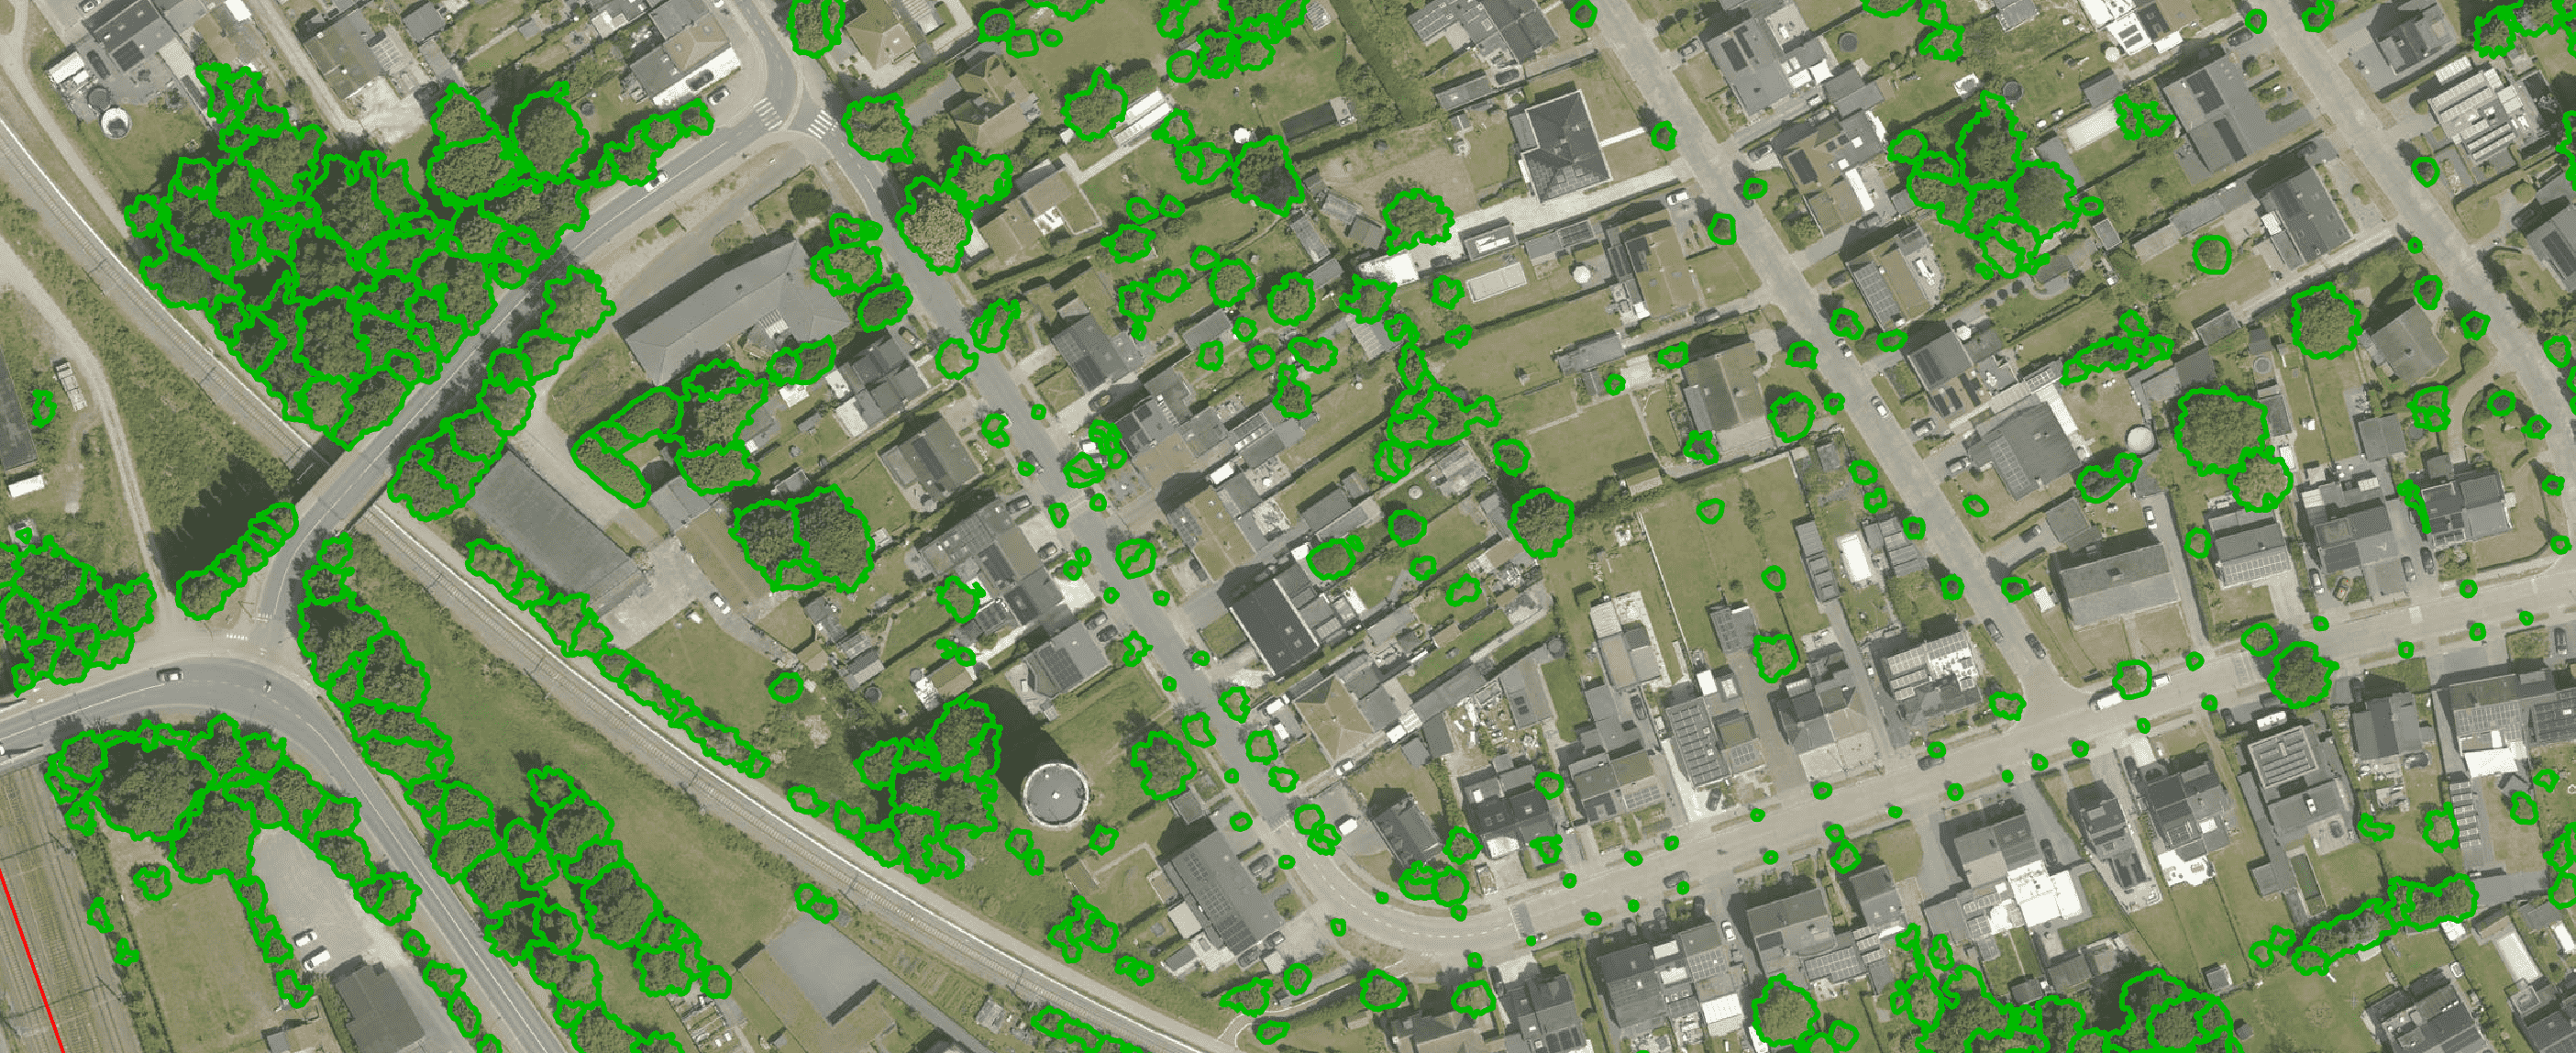
Get a complete overview of trees in your area, including individual characteristics such as crown area and height, and use the data to apply the European 3-30-300 rule for optimal urban greening. Ideal for municipalities, planners and green space managers who need accurate, scalable and policy-relevant geospatial data
read more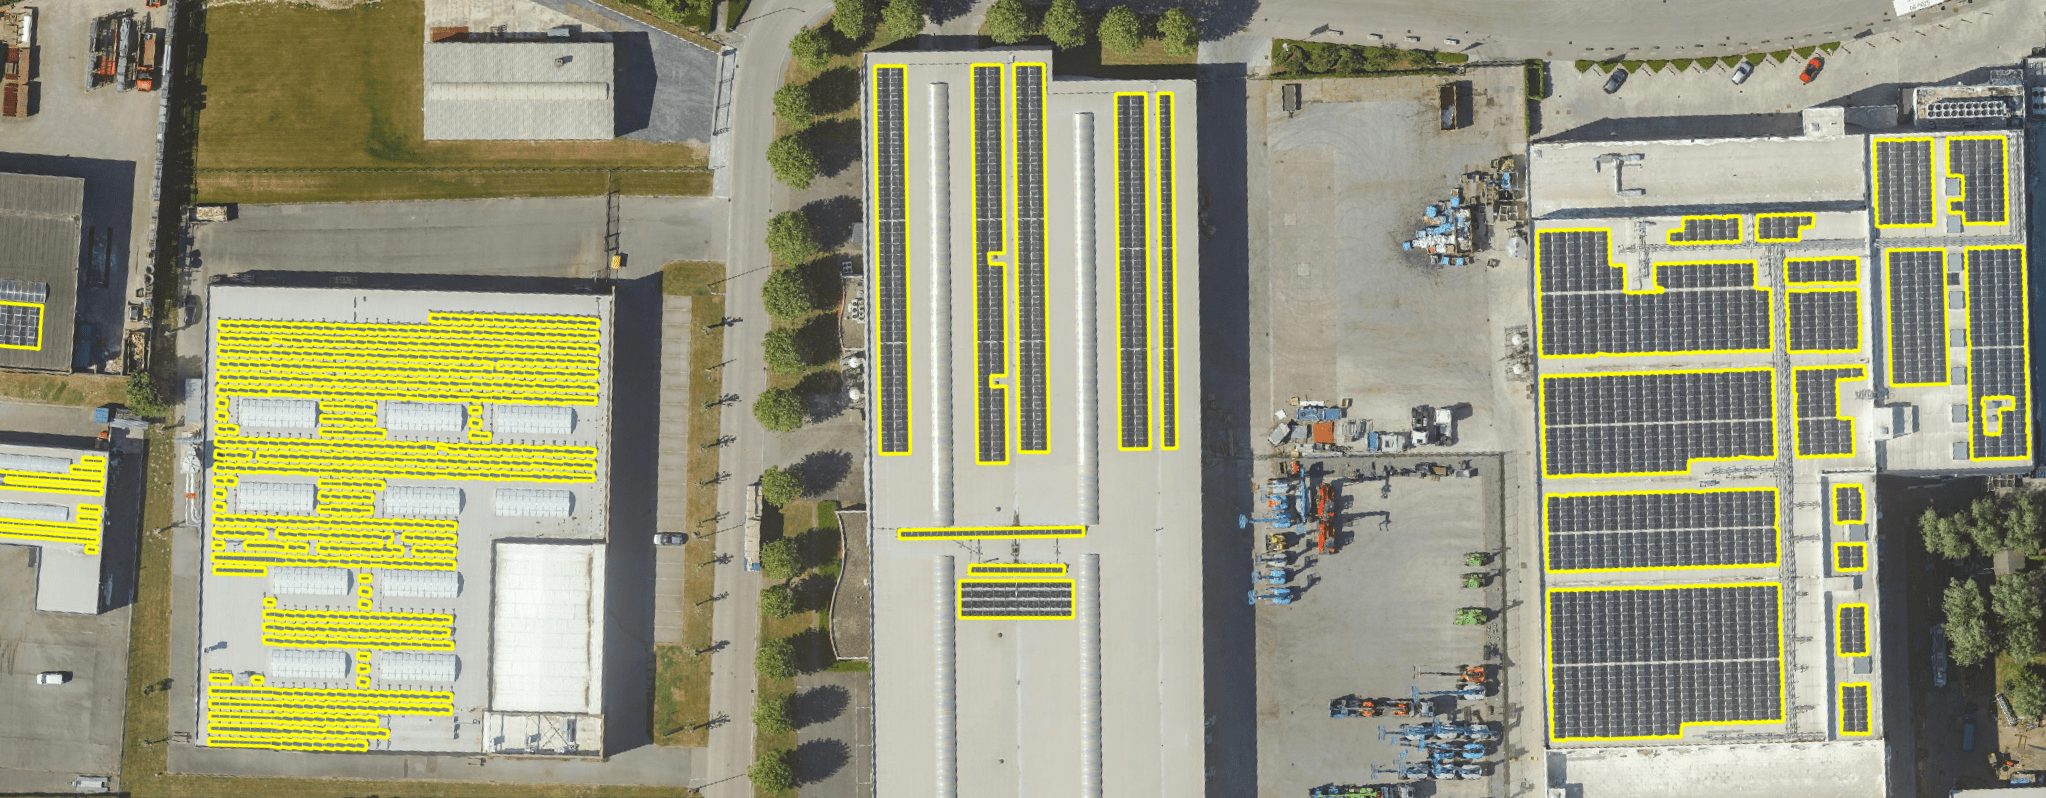
Get a detailed map layer of solar panels at building or cluster level, including surface area calculations per cluster. Ideal for anyone working with geospatial data who wants insight into energy potential and roof utilisation.
read more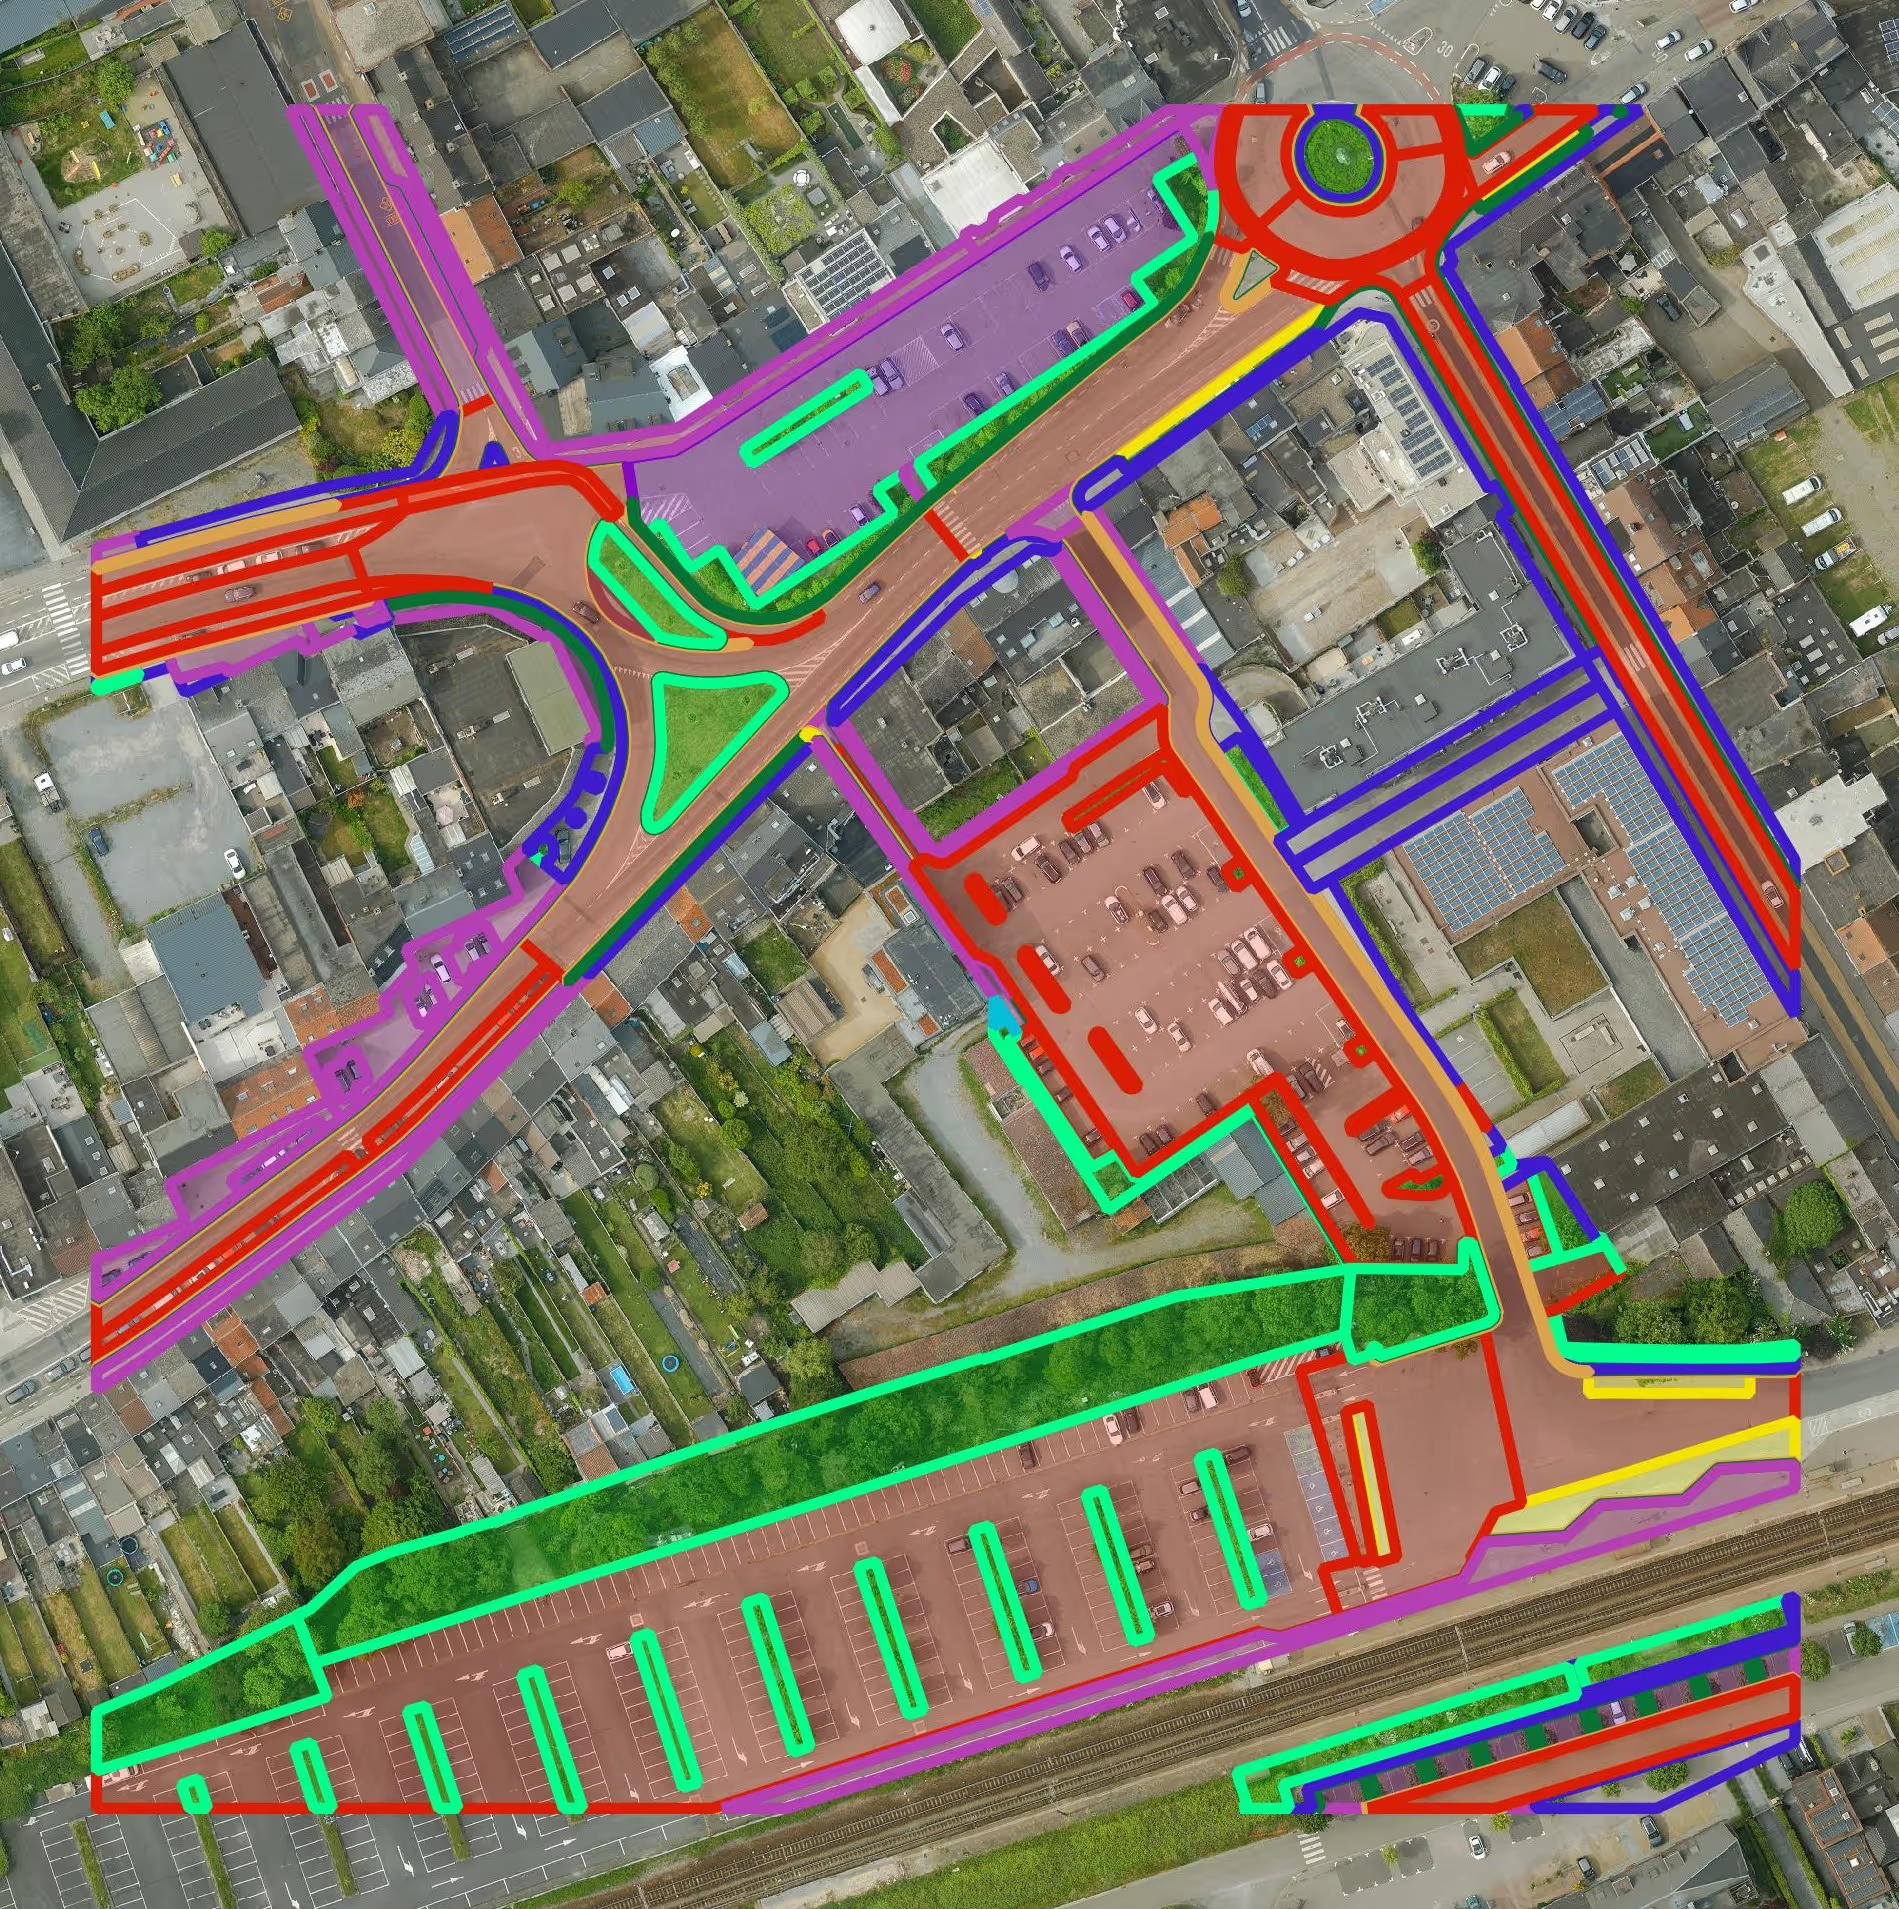
Get a detailed map layer of the public space with classification by object and material. Ideal for anyone working with geospatial data who needs more detail than existing reference data provides.
read more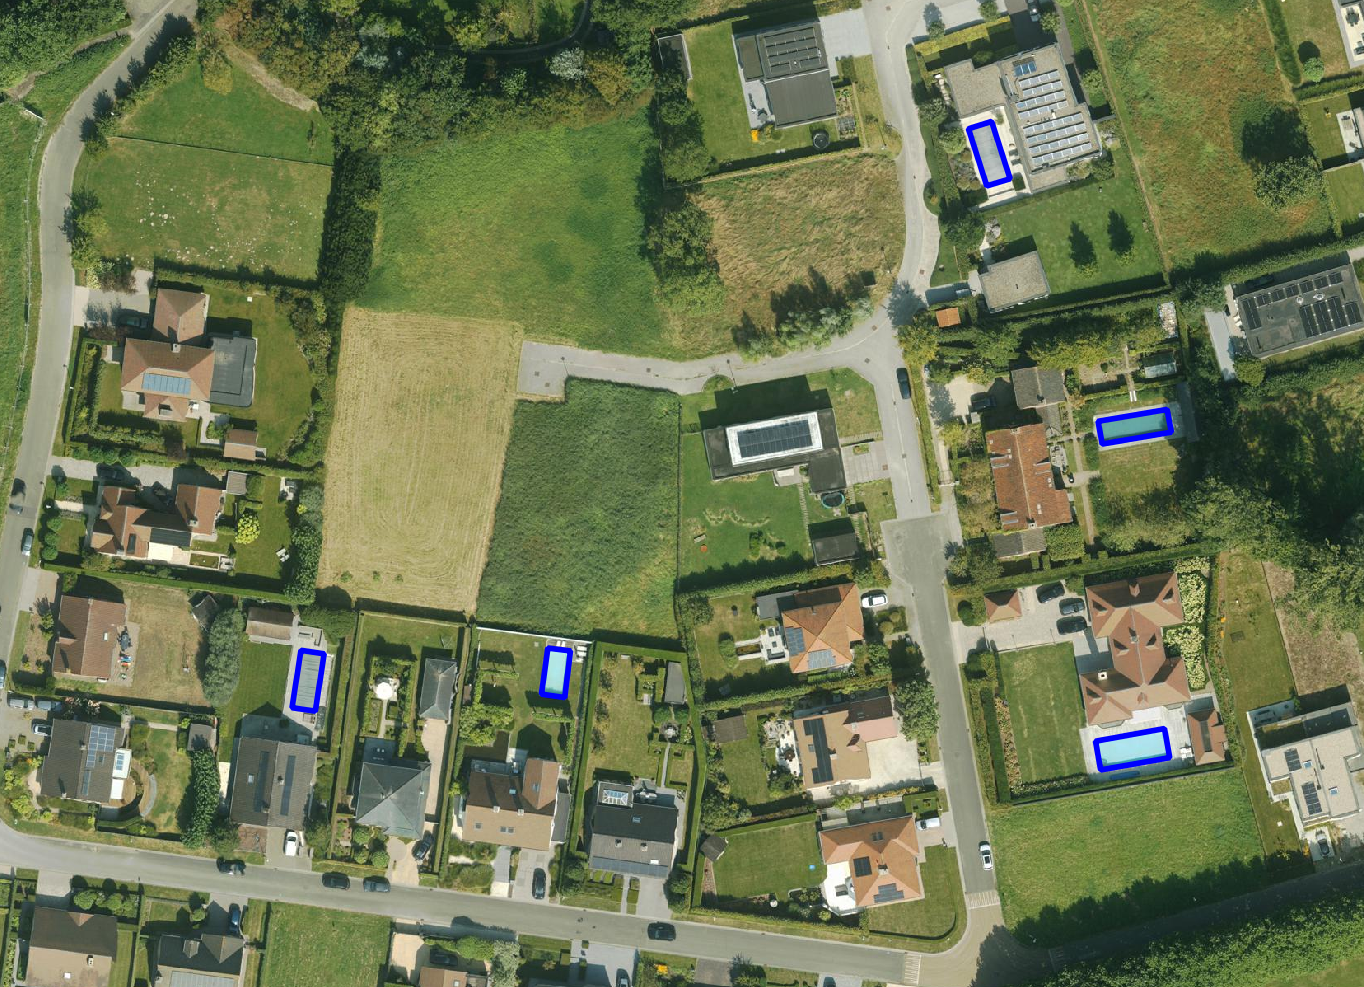
Get a detailed map layer of swimming pools at parcel or object level, including surface area calculations. Ideal for anyone using geospatial data for policy analysis, permits or trend research.
read more
Get a complete inventory of all road markings within your project area, classified into objects, lines and surfaces and linked to the correct underlying surface. This gives you objective data to support maintenance planning, reporting and policy decisions around mobility and asset management.
read more
Our paved/unpaved surface maps provide a complete and objective overview of where the ground is paved or unpaved, in both private and public space.
read moreEvery possible element of a cemetery is mapped. The result is a clear and organised plan that supports efficient and transparent cemetery management.
read more
Do you need a specific inventory that is not yet in our offering? We develop custom inventories tailored to your project. Thanks to our experience with aerial imagery and Deep Learning, we can detect and map almost any object type. Get in touch to discuss the possibilities.
Get in touchBy 2040, Flanders must be asbestos-safe. Our aerial imagery and Deep Learning flag which roofs are suspected per address, so we can work together efficiently towards a healthier and safer living environment.
read moreGet a complete overview of trees in your area, including individual characteristics such as crown area and height, and use the data to apply the European 3-30-300 rule for optimal urban greening. Ideal for municipalities, planners and green space managers who need accurate, scalable and policy-relevant geospatial data.
read moreGet a detailed map layer of solar panels at building or cluster level, including surface area calculations per cluster. Ideal for anyone working with geospatial data who wants insight into energy potential and roof utilisation.
read more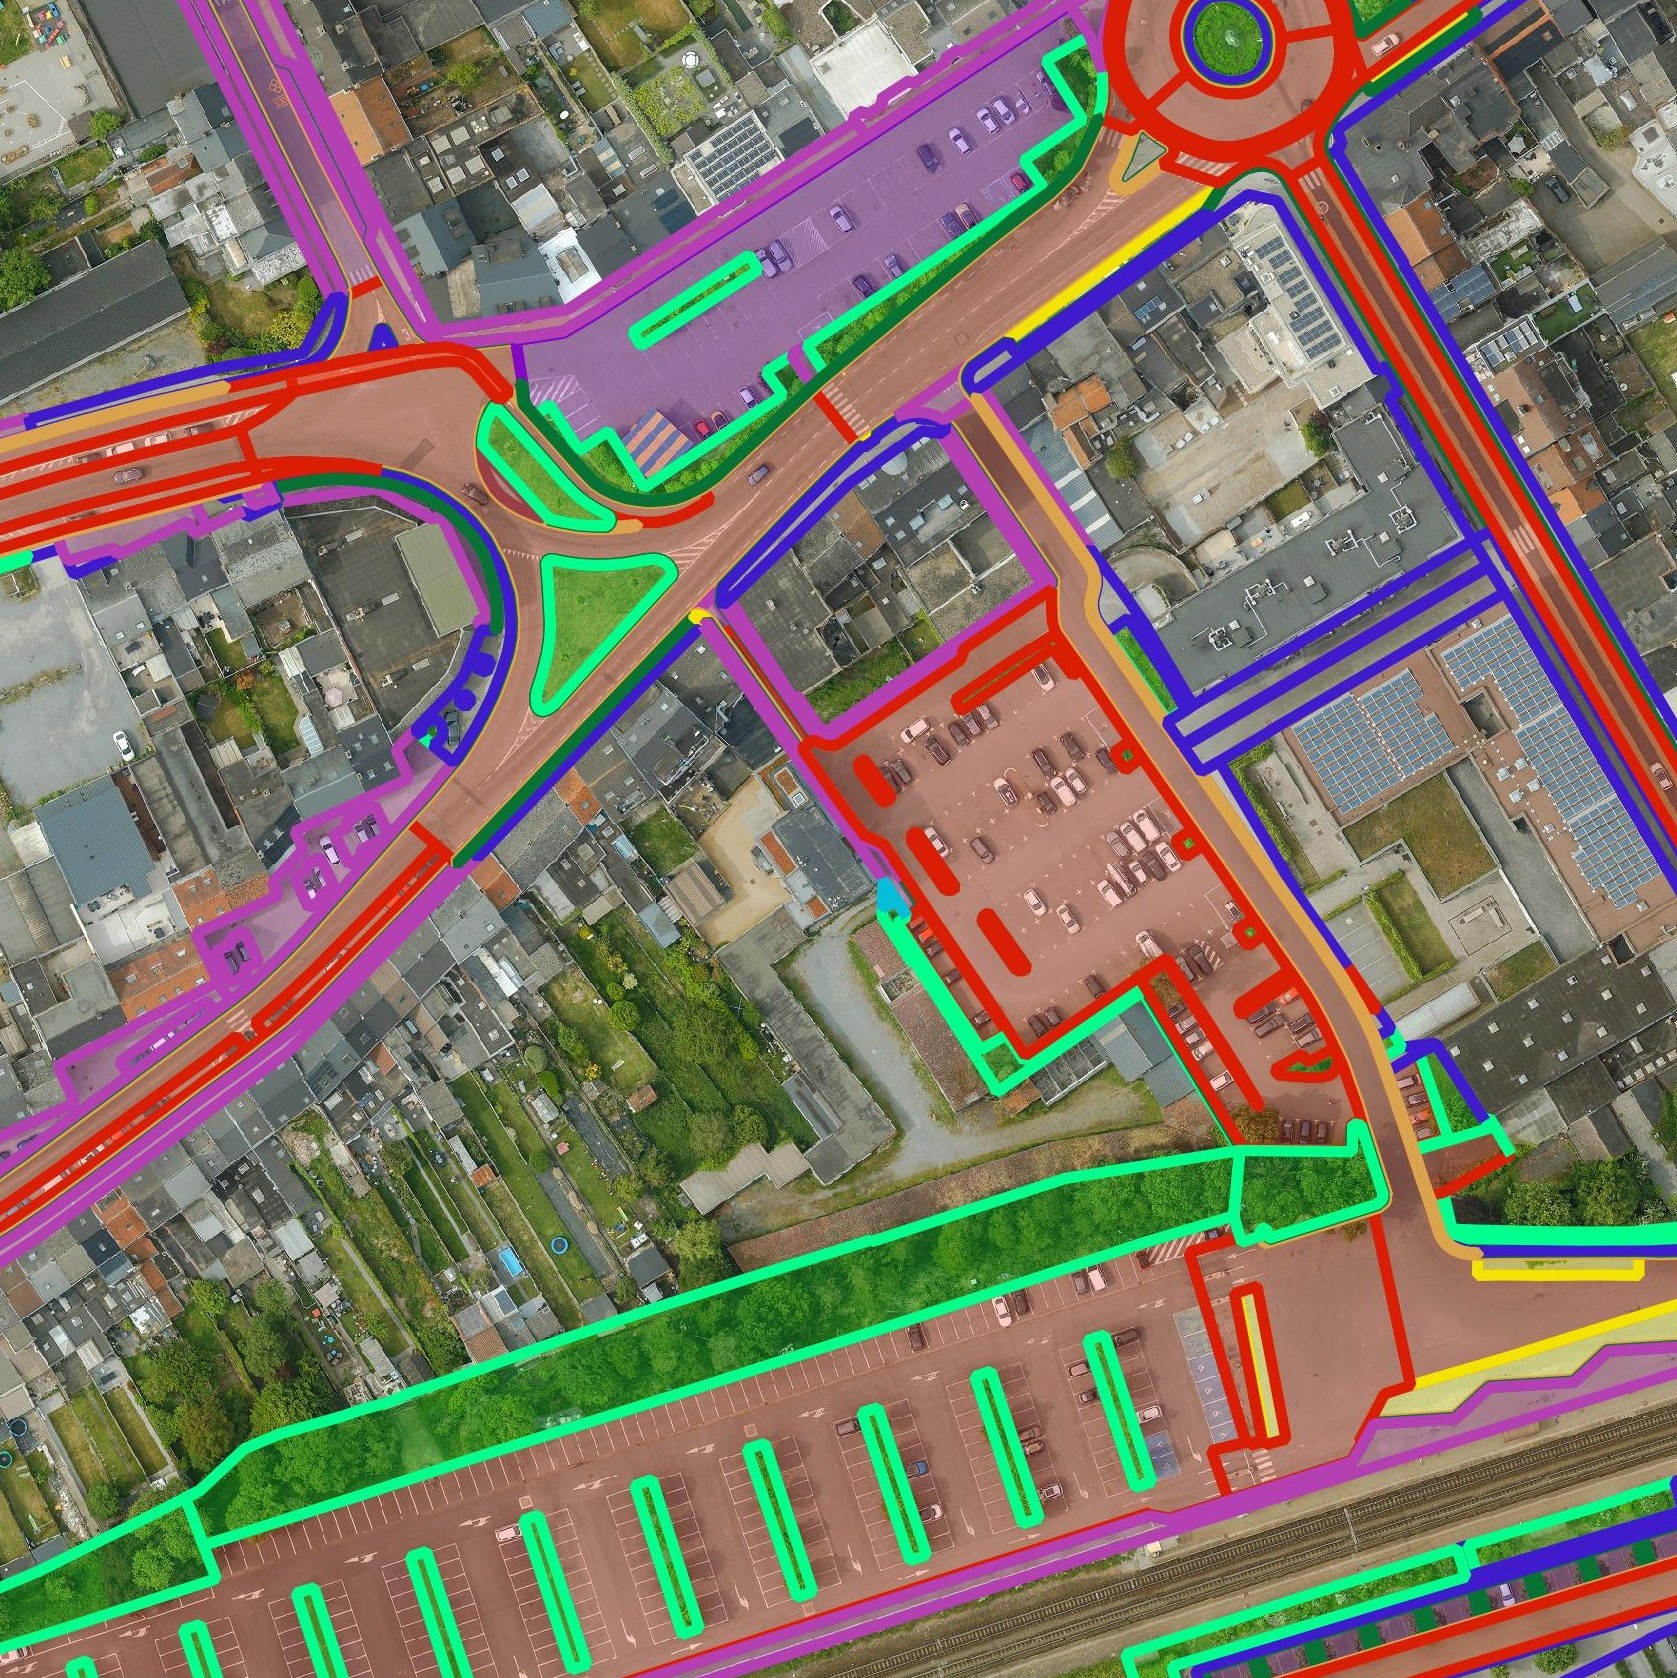
Get a detailed map layer of the public space with classification by object and material. Ideal for anyone working with geospatial data who needs more detail than existing reference data provides.
read moreGet a detailed map layer of swimming pools at parcel or object level, including surface area calculations. Ideal for anyone using geospatial data for policy analysis, permits or trend research.
read moreGet a complete inventory of all road markings within your project area, classified into objects, lines and surfaces and linked to the correct underlying surface. This gives you objective data to support maintenance planning, reporting and policy decisions around mobility and asset management.
read moreOur pavement surface maps provide a complete and objective overview of where the ground is paved or unpaved, in both private and public space.
read moreEvery possible element of a cemetery is mapped. The result is a clear and organised plan that supports efficient and transparent cemetery management.
read moreDo you need a specific inventory that is not yet in our offering? We develop custom inventories tailored to your project. Thanks to our experience with aerial imagery and Deep Learning, we can detect and map almost any object type. Get in touch to discuss the possibilities.
Get in touch
Gain insight into the degree of surface sealing per parcel and per public space and use the data to objectively support climate adaptation, permits and spatial plans.
Monitor sealing pressure and water permeability at regional scale and support policy goals such as the building shift, drought management and flood prevention with reliable maps.
Integrate surface sealing data directly into ArcGIS or QGIS and deliver well-supported designs, environmental impact assessments and climate reports for projects at all scales.

